At first glance, astrophysics may not seem to have much in common with tracking and predicting the spread of a global virus. But to Professor Niayesh Afshordi, the link was clear—even early last year as our collective reaction to COVID-19 played out in real time.
As with modeling the dark matter behavior in the Universe, modeling the spread of COVID-19 requires identifying invisible drivers and interpreting the changing variables that our universe throws at us, in the face of uncertainty.
Before the pandemic, Afshordi, a professor of Physics and Astronomy at the University of Waterloo had plans to start a project with a colleague, Professor Ben Holder from Grand Valley State University, who had just come to Waterloo to spend a sabbatical with Afshordi.
Holder, an expert in modeling within-host virus dynamics, had been planning to transition his work towards black holes. Instead of tackling the mysteries of space-time, however, the pair ended up taking on the mysteries of COVID-19.
“We were eagerly awaiting the data coming out of black hole collisions, and yet what we kept seeing was the deluge of data on exponential growth of epidemic across the world,” said Afshordi. “There were clearly patterns, but the geographic and demographic dynamics that drove these patterns was a mystery that was just too hard to ignore.”
In an effort to understand the changes happening around them, Afshordi and Holder started studying how population distribution contributed to the growth rate during the early epidemic. This project quickly expanded into a multi-disciplinary project as it caught the attention of other collaborators, including two expert data scientists from Wolfram Research Institute, Waterloo philosophy professor Steve Weinstein and a former Ph.D. student of Afshordi’s, Elizabeth Gould (MSc ’11, Ph.D. ’18).
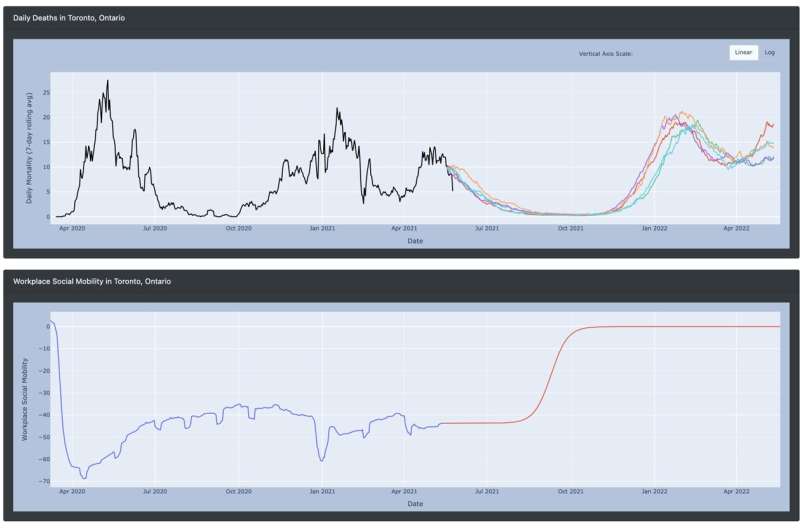
The interdisciplinary team went on to develop a sophisticated COVID-19 model that uses not only population distribution, but also age, average household density, regional epidemic history, weather, social mobility in workplaces, mask usage, and the level of vaccination in an area.
Recruiting coop students Shafika Olalekan Koiki, a 2nd year physics and astronomy student, and Jolene Zheng, a 3rd year computer science student, the team was able to create an online portal for interacting with the data and model.
The MyLocalCovid portal lets anyone select a specific region in Canada, or county in the United States, and then see how changes in people’s activities affect the local model projections. Users can specify different percentages of face mask usage (as measured by Google searches for facemasks), the amount of social mobility in the region (how close to a total lockdown or normal activity), as well as the percentage of people getting a vaccine each week, to see how these factors all influence future COVID mortality in the region.
“I didn’t anticipate a coop position quite like this one for my first work term but it was definitely an intriguing experience. It opened my eyes and showed me the similarities between solving the mysteries of the universe and pandemic modeling,” said Olalekan Koiki. “Working on this dashboard has been a learning experience but it has also been quite fulfilling knowing that you’re working towards an important issue that will hopefully benefit many people.”
The preliminary results of this research (from Summer 2020) are available as a preprint and are being published in the proceedings of “Fields Institute Seminar on Mathematical Modeling of COVID-19,” while a more comprehensive publication is forthcoming. The MyLocalCOVID portal is being kept up to date as new prevention strategies are adopted and new infection drivers are identified.