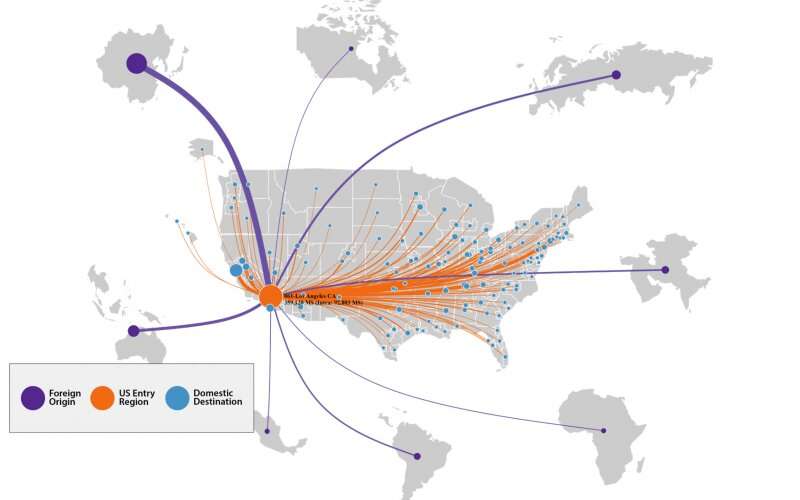
A newly released dataset that tracks the movement of everything from food to gasoline across the United States by air, water, truck, rail and pipeline showed the value and tonnage of those goods rose significantly between 2012 and 2017.
The Freight Analysis Framework, or FAF, is the most comprehensive public database of freight movement in the country, compiled by Oak Ridge National Laboratory and released every five years by the U.S. Department of Transportation.
The recent release, FAF5, revealed that 20 billion tons of U.S. goods valued at nearly $19 trillion were moved in 2017 compared with 17 billion tons valued at about $18 trillion in 2012. Trucks consistently transport about 64% of that freight.
“We help DOT build a comprehensive picture of where and how goods traveled and what commodities are being moved. The goal is to provide federal and state planners with critical data to inform infrastructure investment decisions,” said ORNL’s Ho-Ling Hwang.